Claims processing
Background
Department mission: Digitally transform the manual paper based processes of Department of Health
Key challenges for the department:
- Since the process of claims was paper based, it was very inefficient
- The paper based claims process was prone to manual errors
- Delay in rendering services to citizens
My contribution
- Conducted stakeholder interviews, focus group studies, shadowed users and contextual enquires
- Articulated user needs and stories
- Created experience maps and journey maps
- Conceptualised various solutions through site maps, navigation flow diagrams and Lo-Fi prototypes
- Designed Hi-Fi functional prototypes in code
- Created scenarios and tasks for usability testing and carried the tests
User research
Audience : Internal staff of Department of Health who process the overseas registrations and claims.
Goals : Validate eligibility and process claims in 48 hours of receiving the request.
Pain points : The claims workflow is manual and paper based. It takes around 20 minutes to validate 1 claim. The process is prone to human errors and back- tracking these errors can be extremely time consuming.
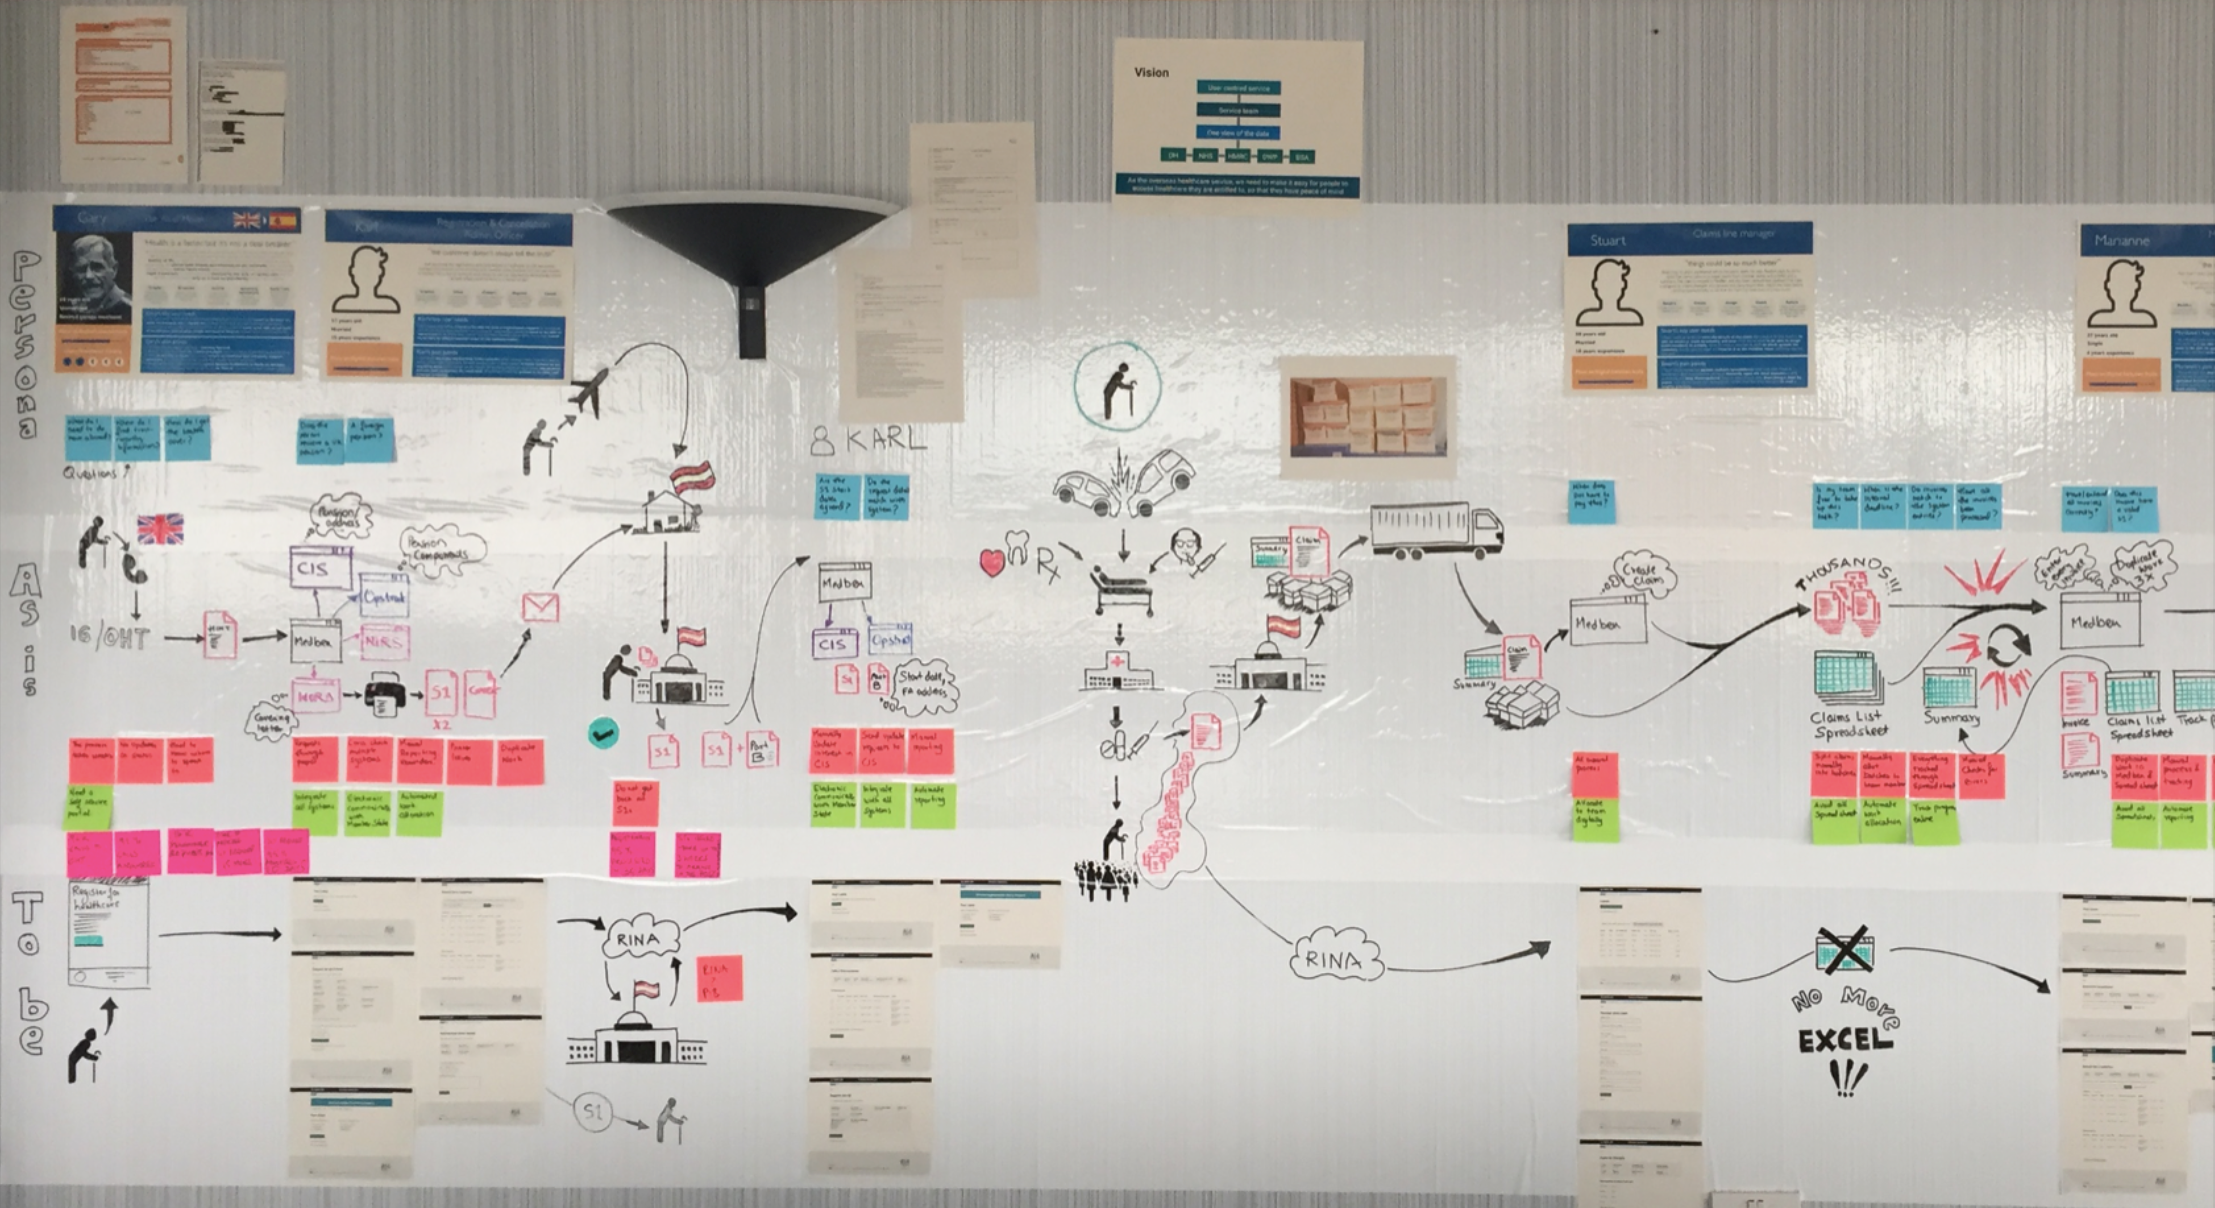
Service map
Following comprehensive user research, I developed a detailed service map that visualized all stakeholders involved in the claims process and the various systems they interact with. This mapping exercise helped identify pain points, redundancies, and opportunities for process optimization in the claims workflow.
The service map became an essential tool for understanding the end-to-end journey and informed our subsequent design decisions.
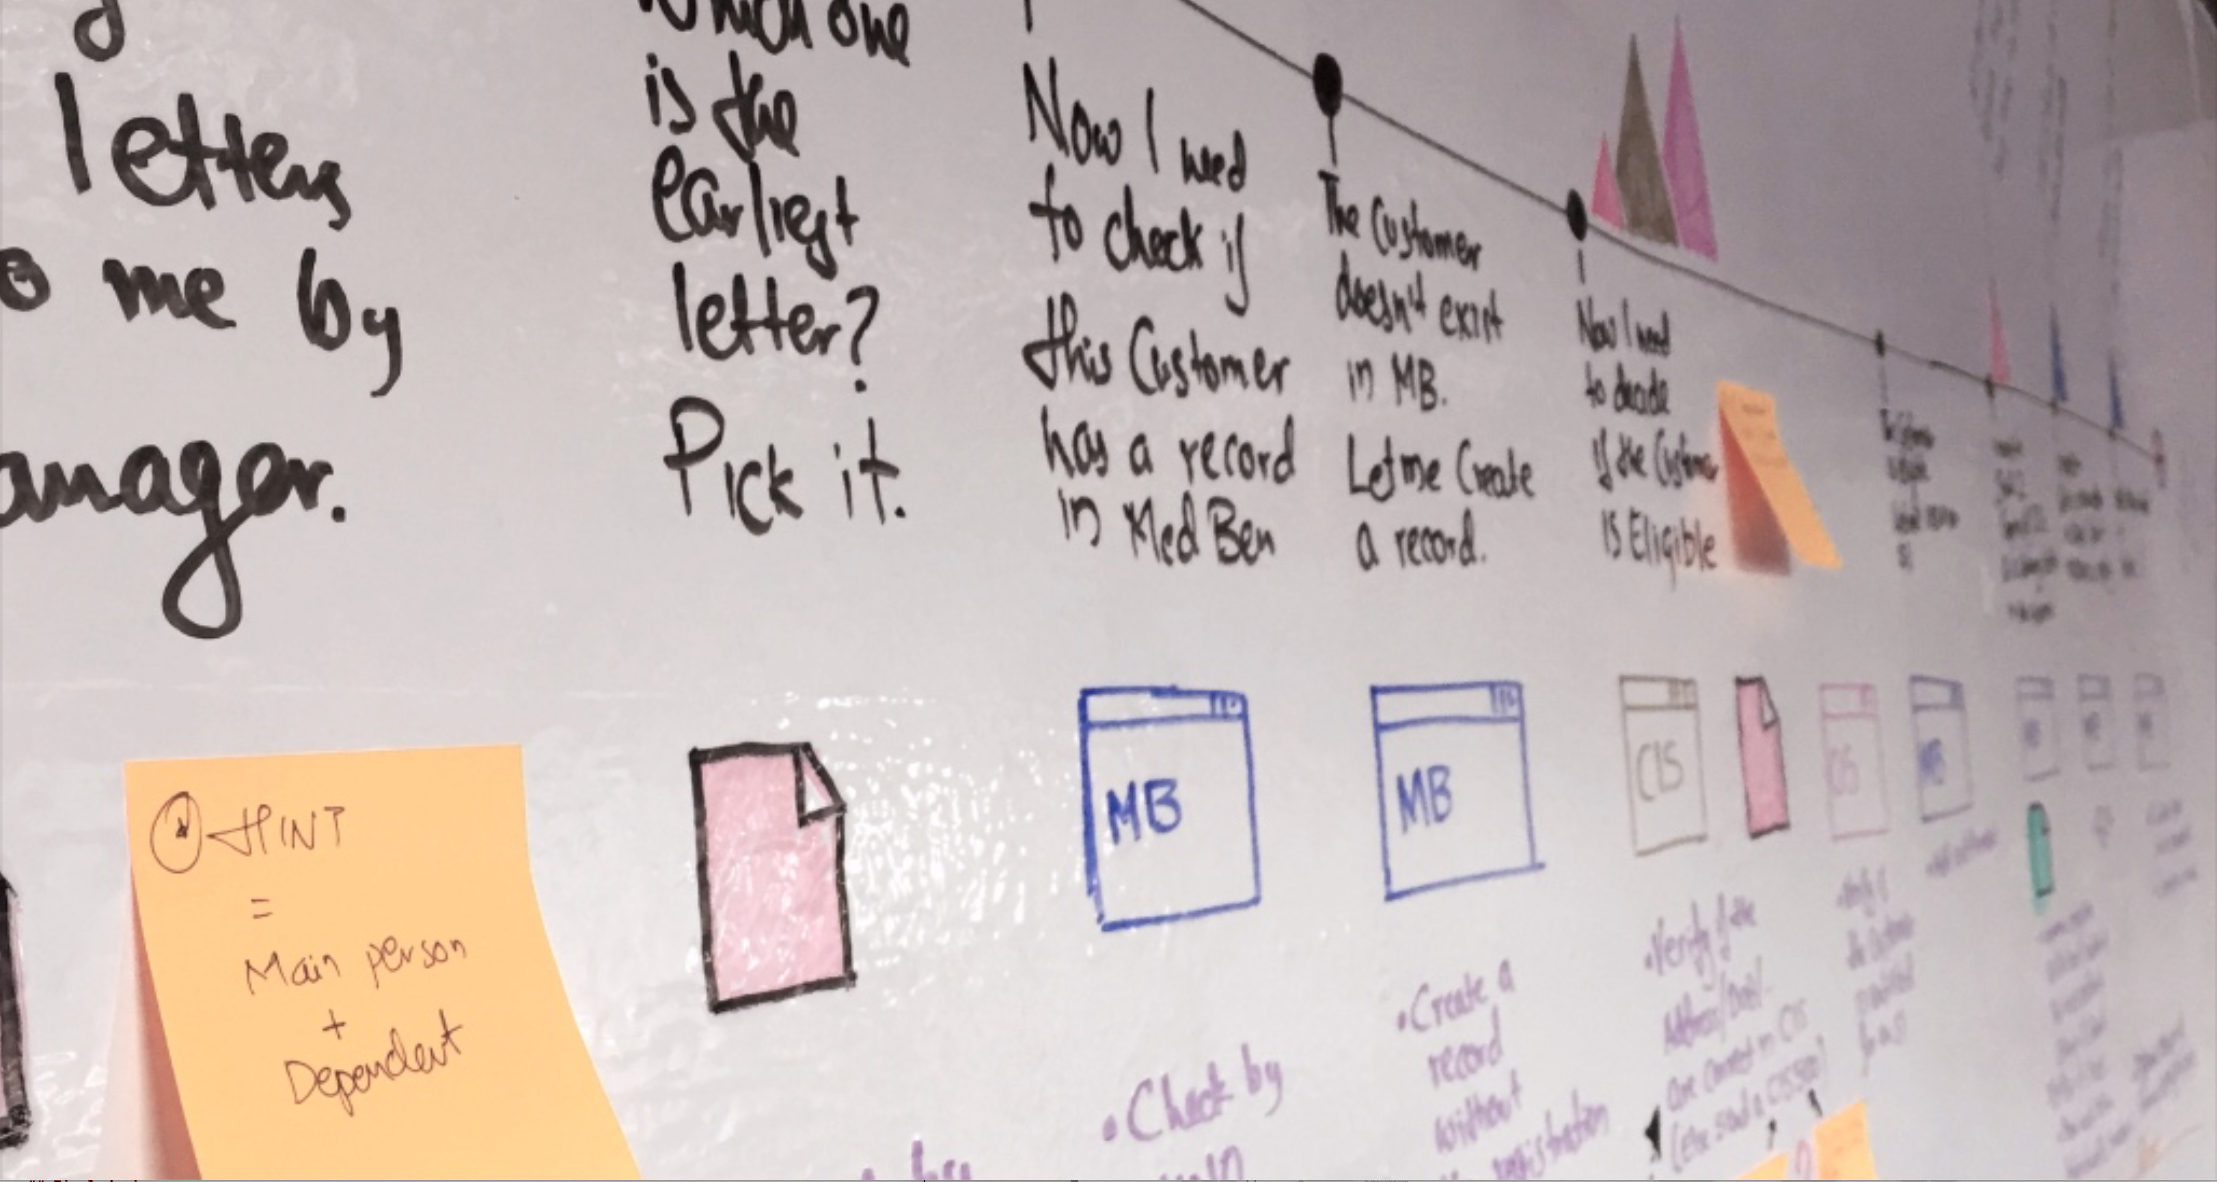
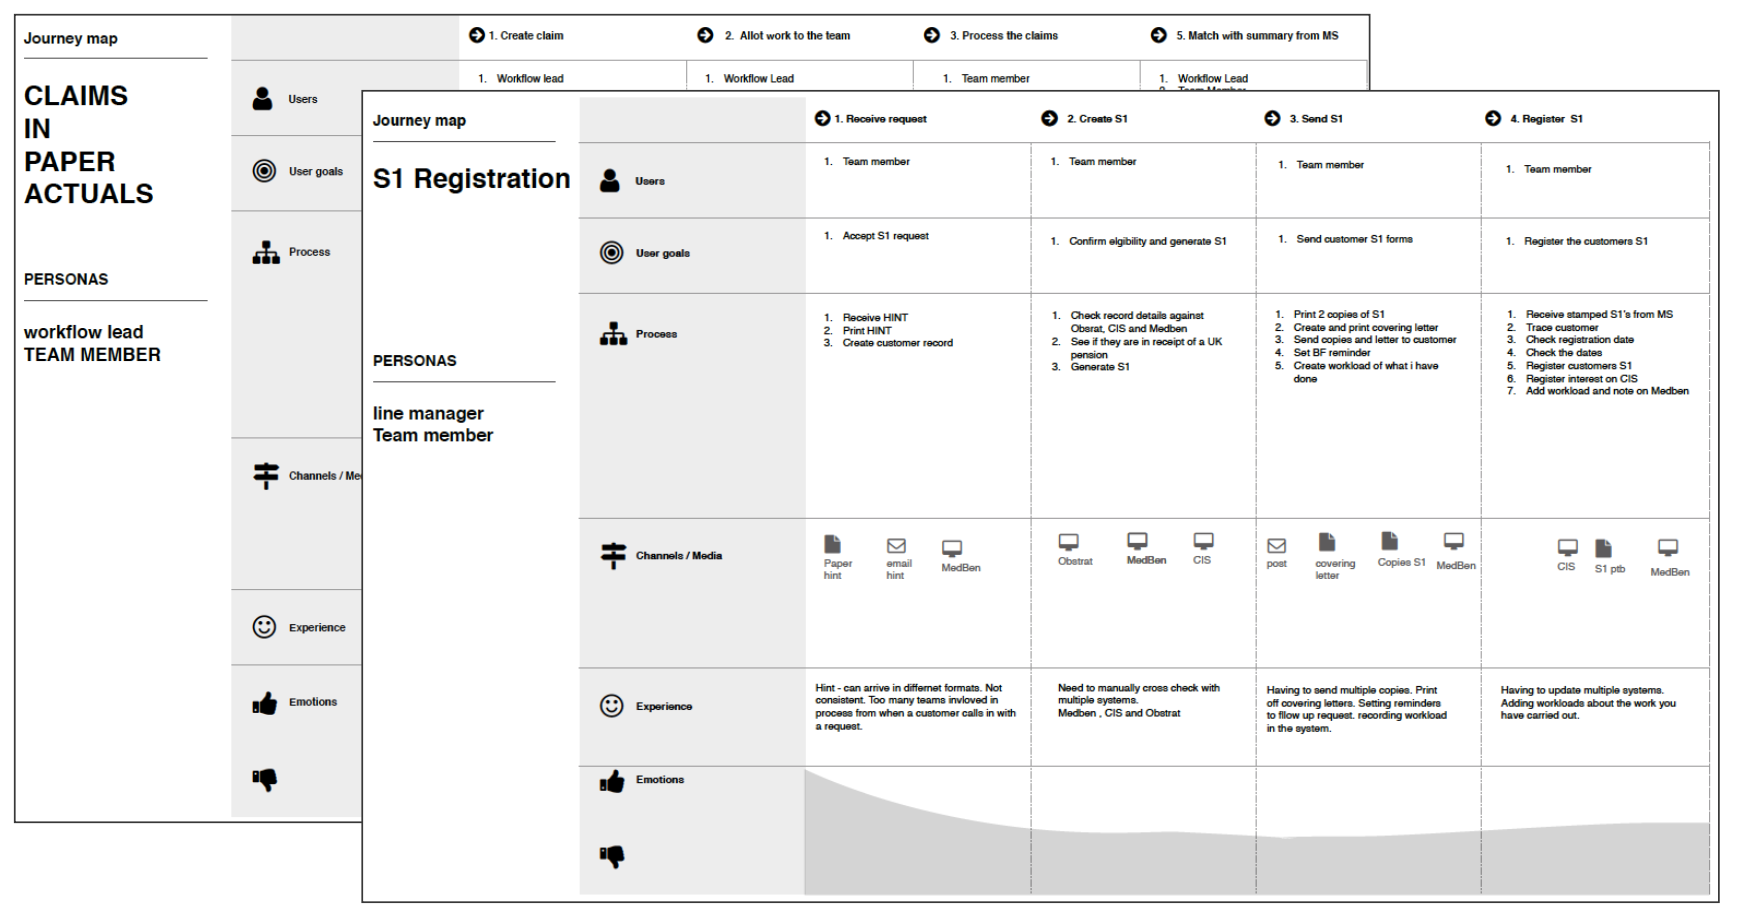
User journey map
Based on the research findings, I created a detailed user journey map to visualize the end-to-end claims processing experience from the perspective of internal staff. The journey map highlighted key activities, pain points, and emotional states across different stages of claims processing.
Key insights from the journey mapping exercise:
- Staff spent significant time manually entering data from paper forms
- Multiple back-and-forth communications were needed to resolve incomplete/incorrect claims
- Lack of standardization led to inconsistent processing approaches
- Limited visibility into claim status made it difficult to provide updates
- Physical storage and retrieval of paper documents was time-consuming
The journey map helped align stakeholders around user pain points and opportunities for improvement through digitization. It became a crucial artifact for prioritizing which aspects of the process to transform first.
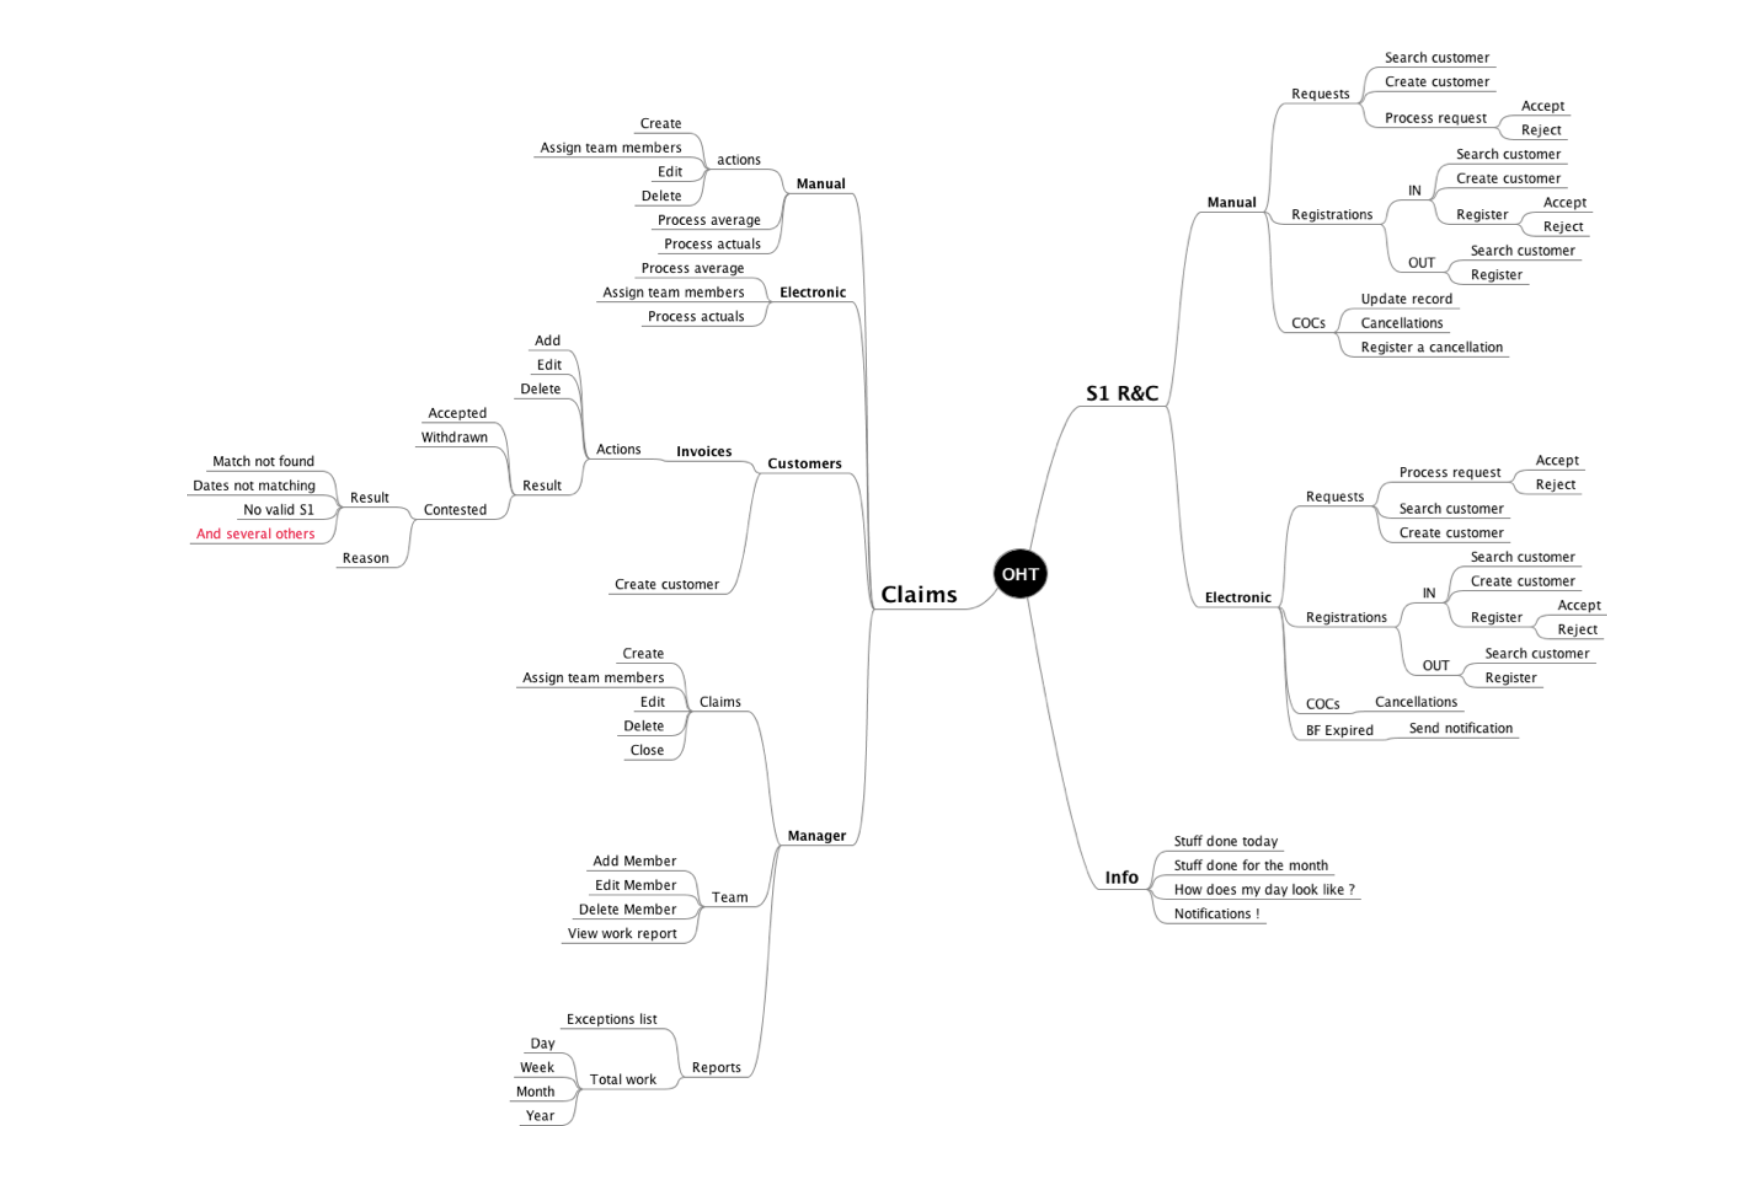
Information architecture
After synthesizing research insights, I created an information architecture that organized the system's content and functionality in an intuitive way. The IA focused on streamlining the claims validation workflow while ensuring all necessary information was easily accessible.
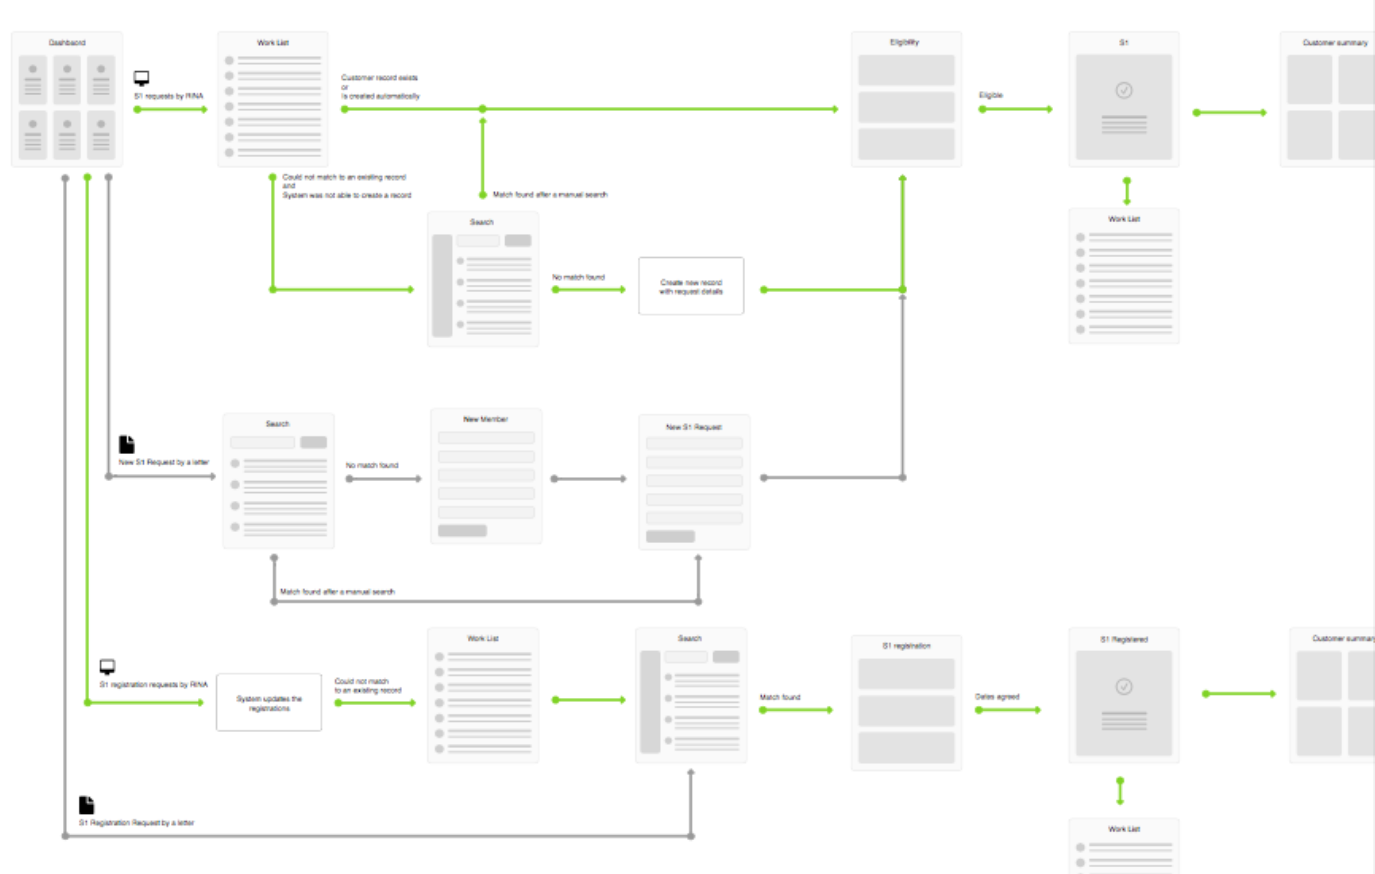
User flow diagram
I developed detailed user flow diagrams to map out the step-by-step process of how staff would interact with the digital claims system. The flows helped identify opportunities to reduce friction and automate manual steps.
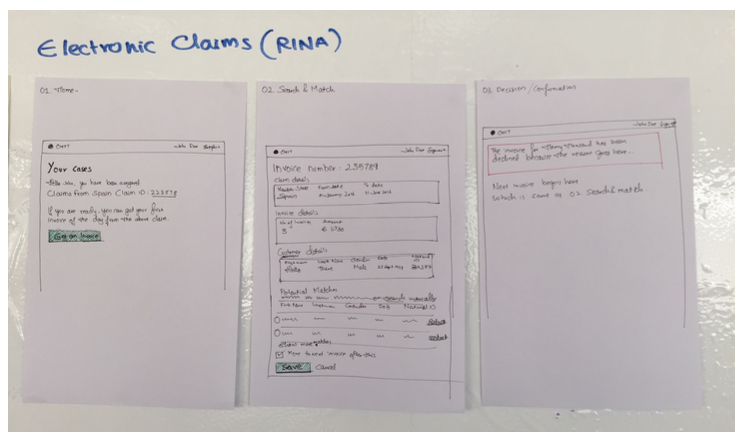
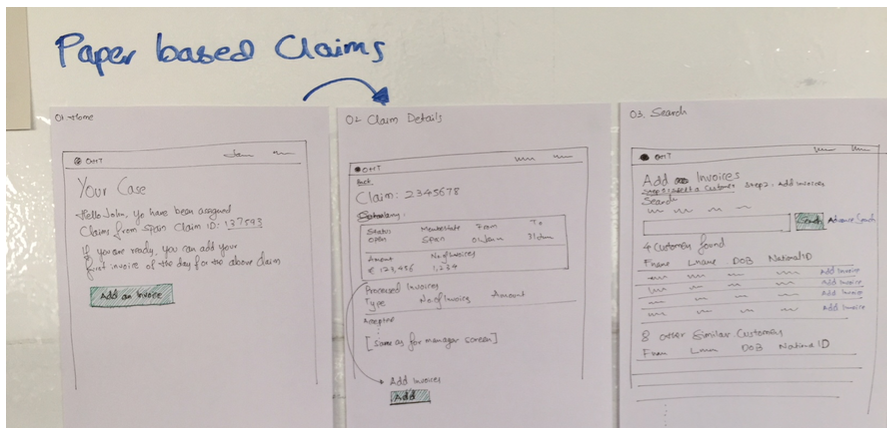
Lo-Fi prototypes
Initial low-fidelity wireframes were created to explore different approaches to the claims interface. These prototypes focused on core workflows like claim validation, data entry, and status tracking.
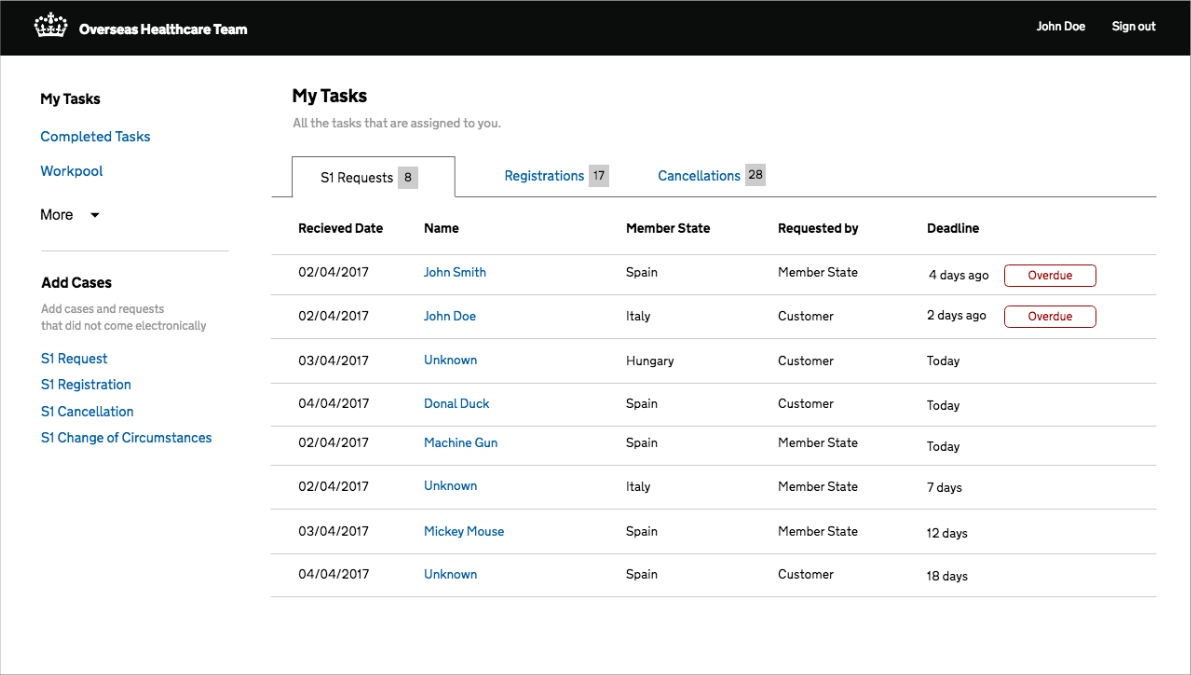
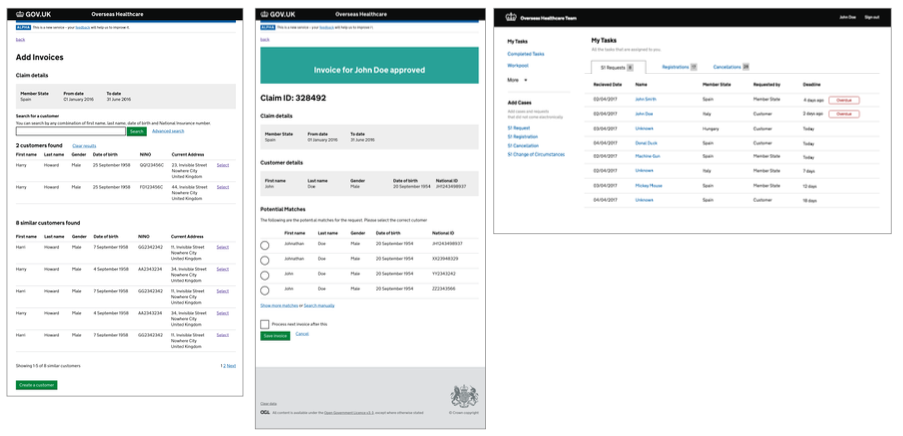
Final design
The final interface design prioritized efficiency through:
- Clear dashboard views of claim status and workload
- Streamlined data entry with validation
- Automated routing of claims based on type
- Digital document management
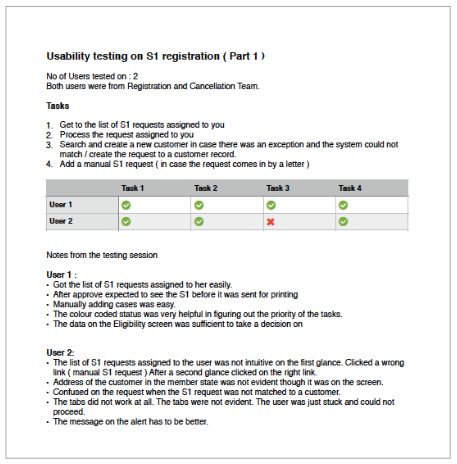
Usability testing
I conducted usability testing sessions with claims processing staff to validate and refine the design solutions.